Final Exam: Dangerous Curves
By Krista Floer
Graph
Interpret. What would you change to explore and understand the graphs?
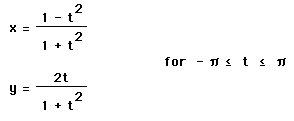
First we need to graph the original parametric curve:
 |
|---|
 |
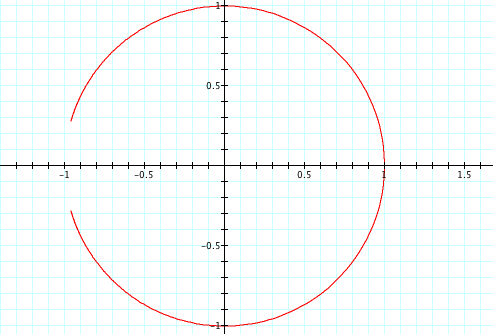
We can see that this is almost a circle. The circle has a radius of 1, but the circle is not fully closed. It seems that if the circle was continued on the left side that the radius is still 1. To figure out why this is, we have to look at values of t. Because the graph stops on the x-axis at the same place on the top and bottom of the circle, I thought this would be an asymptote. If you substitute -![]() in for t for the x equation, you get about -.81. After thinking about this, I realized this is not so much an asymptote, but we limited the values for t so the circle could not be completed. So I chose a larger number than
in for t for the x equation, you get about -.81. After thinking about this, I realized this is not so much an asymptote, but we limited the values for t so the circle could not be completed. So I chose a larger number than ![]() so that I could see if it helped close the circle at all. Consider the the graph of the same parametric equations, but t ranges from -7 to 7.
so that I could see if it helped close the circle at all. Consider the the graph of the same parametric equations, but t ranges from -7 to 7.
Comparing the previous graph with this one, we see that the circle has been closed in a little. I guesses that t must have been a limiting value, so I chose a much larger number, -1000 to 1000. This completely changed the shape into a combination of a semicircle on the left and a polygon on the right. But I saw that the "circle" was completely enclosed. I decided to choose a much smaller number: -80 to 80. Here, the right still looked like a polygon, but the left seemed like it was completely closed. After zooming in, i saw that it wasn't.
 |
 |
|---|
Thinking that there has to be some point where the two ends of the circle will meet, I tried solving this problem algebraically. Letting y be zero and solving for t in the equation for x, t = -1 or 1. When you substitute -1 for t in the equation for x, zero is in the denominator. Hence, x is undefined when t = -1. This would explain why the y-values approach zero while the x-coordinates for those y-values approach -1, but we never get a point that has coordinates (-1,0). Another way to think about this is that for the x-coordinate lim (t->-infinity)  = -1, and for the y-coordinate lim(t->-infinity)
  = 0.
= 0.
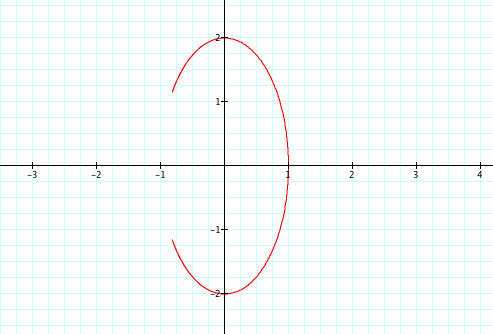
Consider this graph. The value for t ranges from -15 to 3.

We can see that the minimum value for t changes the distance between the bottom gap of the circle to the x-axis, and the maximum value changes the distance between the top gap of the circle to the x-axis.
So we have found that changing the value for t either widens or closes the gap of the circle. Now we move on to discover what other parts of the equations do.
Let's first look at the equation for y: ![]() . The first thing I thought to change would be the 2 in the numerator. If I change it to 4t, this is what the graph looks like:
. The first thing I thought to change would be the 2 in the numerator. If I change it to 4t, this is what the graph looks like:
My first thought to explain what happened is that since we are looking at the equation for y, the range of the graph will change. The range of the graph is 4, so I have found a possible connection. To see if this holds true I tried a few other numbers to replace 4.
   |
|---|
 |
You can see how the pattern still holds true. There will still be a root at 1 because we have not changed the equation for the x-coordinate. So we know how the numerator for the y-coordinate controls the shape of the graph, what about the denominator?
Here is the equation for y again, ![]() . First I changed the 1 in the denominator to 2, 3, 4, 5, and 9:
. First I changed the 1 in the denominator to 2, 3, 4, 5, and 9:
|
|---|
 |
The first 4 seemed to be similar in shape and were closing in on the x-axis. But the equation with 9 seemed to start changing shape a little, but was still getting closer to the x-axis.
     |
|---|
 |
The shape seems to be similar here again, yet different from the ones above. These are more concave, while the others were more convex. All were always getting closer to the x-axis. To write this in the form of limits, we need to change the equation a little. Let  . Now, lim(n->infinity)
  = 0. To get this we use L'Hospital rule which states that we can differentiate the numerator and denominator separately to find a limit. We end up with 1/t, which is known to have a limit of 0. Again, since we have not change the equation for the x-coordinate, the domain stays the same.
Since we have explored the different parts of the equation for y, we now need to do the same thing for the equation of x.
First consider the numerator:  . Changing the 1 in the numerator we get the following set of graphs:
     |
|---|
 |
It is clear that this number in the equation changes where the positive root is located. The range is still (-1, 1) because we have not changed the equation for y.
Now let's look at the denominator. Changing the 1 in the denominator to the values of 2, 3, and 4 we get the following set of graphs:
    |
|---|
 |
At first I could not find the relation between these whole numbers and why the graphs kept getting skinnier, but then I looked at the numerator and denominator together. The numerator stayed the same, and the constant value was 1. Pairing the 1 each time to the new constant in the denominator we have: 1 & 1, 1 & 2, 1 & 3, and 1 & 4. From here I saw the relation. Write each pair as a fraction. Each fraction represents where the graph for that equation will intersect the x-axis.
This led me to the realization that the constant in the numerator and the constant in the denominator do not act independently, but rather together. When we changed the constant in the numerator, the constant in the denominator was one so together it was a whole number. It wasn't until I changed the constant in the denominator that this became apparent. The graph can be made to have any root, as long as the root can be written as a fraction.
Some of the math for this assignment is similar to the assignment here.
For the Graphing Calculator file, click HERE. All of the above investigations can be done on this file.


